


Here's What Grok Told Me About Tesla's Current Valuation
It's not a pretty picture for Tesla bulls.

There is no shortage of opinions on Tesla. There’s even a Substack- Motorhead- dedicated to making the bearish case for Tesla.
I just asked Grok to provide me with a conventional valuation of Tesla (TSLA).
I chose Grok because if there is a Tesla-friendly AI, it must be the Elon Musk-sponsored Grok. (I did not test Chat GPT or Google Gemini or Claude.)
The results were pretty eye-popping.
Here is Grok’s unvarnished opinion:
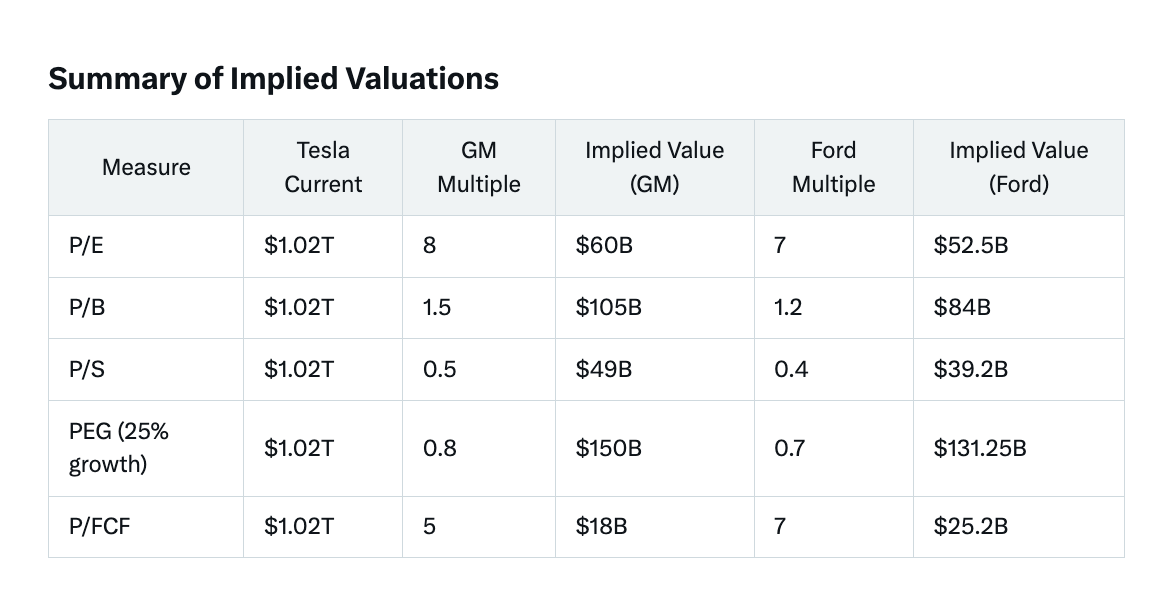
To estimate what Tesla would be worth if valued like another U.S. car company based on earnings, book value, growth, and other comparable measures, we’ll compare Tesla to traditional U.S. automakers like General Motors (GM) and Ford, which are often used as benchmarks in such analyses.
I’ll set out each measure individually, calculate Tesla’s implied valuation using the multiples of GM and Ford, and provide commentary. Since my knowledge is continuously updated, I’ll use the most recent data available as of February 28, 2025, and make reasonable assumptions where exact figures aren’t specified in the prompt.
For simplicity, I’ll base calculations on Tesla’s trailing twelve-month (TTM) financials and stock metrics as of the latest reports (e.g., Q4 2024), and I’ll use GM and Ford’s multiples as proxies for "another U.S. car company."
Tesla’s Current Valuation (Baseline)
As of February 28, 2025:
Tesla’s market capitalization is approximately $1.02 trillion (based on a share price of ~$320 and 3.19 billion shares outstanding, adjusted for minor dilution).
I’ll use this as the starting point to compare against implied valuations.
Financial Data for Tesla (TTM, approximate as of Q4 2024)
Earnings (Net Income): ~$7.5 billion (based on recent profitability trends).
Book Value (Shareholders’ Equity): ~$70 billion (grown from $62.1 billion in Q3 2024).
Revenue: ~$98 billion (consistent with recent reports of $97.69 billion TTM).
Earnings Growth (5-year CAGR): ~40% (historically high, though slowing recently to ~20-25% annually).
Free Cash Flow (FCF): ~$3.6 billion (operating cash flow of $14.9 billion minus capex of $11.3 billion).
For GM and Ford, I’ll use approximate TTM figures and multiples based on current market data (as of February 2025):
GM Market Cap: ~$90 billion; Ford Market Cap: ~$70 billion.
These will inform their valuation multiples.
Now, let’s calculate Tesla’s implied valuation using each measure, benchmarking against GM and Ford.
1. Price-to-Earnings (P/E) Ratio
Definition: Market cap divided by net income, indicating how much investors pay per dollar of earnings.
GM P/E: ~8 (market cap $90B / ~$11.25B earnings).
Ford P/E: ~7 (market cap $70B / ~$10B earnings).
Tesla P/E: ~136 ($1.02T / $7.5B).
Implied Valuation:
Using GM’s P/E of 8: $7.5B × 8 = $60 billion.
Using Ford’s P/E of 7: $7.5B × 7 = $52.5 billion.
Comment: If Tesla were valued like GM or Ford based on earnings, its market cap would be 5-6% of its current $1.02 trillion, a drastic reduction. This reflects Tesla’s premium valuation, driven by growth expectations rather than current profitability. Traditional automakers have lower P/E ratios due to mature, cyclical businesses with modest growth, while Tesla’s high P/E suggests investors anticipate significant future earnings from EVs, autonomy, and energy.
2. Price-to-Book (P/B) Ratio
Definition: Market cap divided by book value, showing how much investors pay per dollar of net assets.
GM P/B: ~1.5 ($90B / ~$60B book value).
Ford P/B: ~1.2 ($70B / ~$58B book value).
Tesla P/B: ~14.6 ($1.02T / $70B).
Implied Valuation:
Using GM’s P/B of 1.5: $70B × 1.5 = $105 billion.
Using Ford’s P/B of 1.2: $70B × 1.2 = $84 billion.
Comment: Tesla’s P/B is extraordinarily high, reflecting its asset-light model (fewer factories, more IP) and market optimism about future value creation. Valuing it like GM or Ford slashes its worth to 8-10% of its current level, as traditional automakers trade closer to their tangible net worth. Tesla’s premium here stems from intangible assets like brand, technology, and growth potential, which aren’t as significant for legacy peers.
3. Price-to-Sales (P/S) Ratio
Definition: Market cap divided by revenue, measuring valuation per dollar of sales.
GM P/S: ~0.5 ($90B / ~$180B revenue).
Ford P/S: ~0.4 ($70B / ~$175B revenue).
Tesla P/S: ~10.4 ($1.02T / $98B).
Implied Valuation:
Using GM’s P/S of 0.5: $98B × 0.5 = $49 billion.
Using Ford’s P/S of 0.4: $98B × 0.4 = $39.2 billion.
Comment: Tesla’s P/S is 20-25 times higher than GM or Ford’s, reflecting its high growth and margins (17-18% gross margin vs. ~10-12% for peers). If valued like a traditional U.S. automaker, Tesla’s market cap drops to 4-5% of its current value. This gap highlights Tesla’s perception as a tech company with scalable revenue potential (e.g., software, energy), unlike the hardware-focused, lower-margin legacy automakers.
4. Growth-Adjusted Valuation (PEG Ratio)
Definition: P/E divided by earnings growth rate, adjusting for growth expectations.
GM PEG: ~0.8 (P/E 8 / ~10% growth).
Ford PEG: ~0.7 (P/E 7 / ~10% growth).
Tesla PEG: ~5.4 (P/E 136 / ~25% recent growth; historically higher at 40%).
Implied Valuation:
Using GM’s PEG of 0.8 with Tesla’s 25% growth: P/E = 0.8 × 25 = 20; $7.5B × 20 = $150 billion.
Using Ford’s PEG of 0.7: P/E = 0.7 × 25 = 17.5; $7.5B × 17.5 = $131.25 billion.
Comment: The PEG ratio attempts to balance earnings with growth. Even with Tesla’s superior growth (25% vs. 10%), its implied value rises to $131-150 billion—still only 13-15% of its current $1.02 trillion. Tesla’s PEG is inflated due to its sky-high P/E, suggesting its valuation assumes decades of outsized growth beyond what GM or Ford project.
5. Price-to-Free Cash Flow (P/FCF)
Definition: Market cap divided by free cash flow, reflecting cash generation efficiency.
GM P/FCF: ~5 ($90B / ~$18B FCF).
Ford P/FCF: ~7 ($70B / ~$10B FCF).
Tesla P/FCF: ~283 ($1.02T / $3.6B).
Implied Valuation:
Using GM’s P/FCF of 5: $3.6B × 5 = $18 billion.
Using Ford’s P/FCF of 7: $3.6B × 7 = $25.2 billion.
Comment: Tesla’s P/FCF is astronomical due to heavy reinvestment (e.g., $11B+ capex), while GM and Ford generate more cash relative to their size. Valuing Tesla this way yields a mere 2-3% of its current market cap, underscoring its focus on growth over cash flow. Traditional automakers prioritize cash returns, while Tesla bets on future scale.
Average Implied Valuation
GM Basis: ($60B + $105B + $49B + $150B + $18B) / 5 = $76.4 billion.
Ford Basis: ($52.5B + $84B + $39.2B + $131.25B + $25.2B) / 5 = $66.43 billion.
Midpoint: ~$71.4 billion.
Final Comment
If Tesla were valued like another U.S. car company (e.g., GM or Ford) based on earnings, book value, growth, and other comparable measures, its market cap would be approximately $71.4 billion—about 7% of its current $1.02 trillion.
This massive disparity reflects Tesla’s unique position: it’s not priced as a traditional automaker but as a high-growth tech/energy innovator.
Traditional metrics undervalue Tesla’s potential in EVs, autonomy, and energy storage, yet they also suggest its current valuation embeds extraordinarily optimistic assumptions.
Whether this premium is justified depends on Tesla achieving its ambitious goals—something GM and Ford, with their stable but slower-growth profiles, don’t need to match.
TSLA is approaching reasonable valuation but likely will fall much lower because it has negative moat https://imgur.com/a/t1boDps